Big Data, Machine Learning and Artificial Intelligence have started making an impact on our lives and will be the drivers of the most profound changes that will happen in our world in the coming years. This post is not about them.
This post is something more basic. This topic is something I have been touching upon in my workshops for over 10 years. The purpose of this was to get Project Managers excited about numbers and data and statistics and to demystify a simple prediction technique called Monte Carlo Analysis(one of the techniques in ML/AI). Building rudimentary Monte Carlo simulations models is very easy and even in their very simple form they can provide great insight and prediction. These simulations can and must be used in Quantitative Project Management.
Do You Feel Data ? Do you see the events around you as a series of probabilistic outcomes?
In this post I will combine 2 concepts – Game Theory and Monte Carlo Simulation. In subsequent posts I will create few more examples of Monte Carlo analysis that I used to model the behavior of user load on a collaboration platform I had built(& subsequently shelved).
Game Theory
Game Theory is a branch of mathematics which studies competitive scenarios where the outcome is dependent not only on your choices but that of the others also.
The most popularly known Game Theory scenario is what is known as The Prisoner’s Dilemma.
Suppose there are 2 prisoners who are obviously trying to escape. It will be beneficial to both if they co-operate with each other. But life is not so simple. What if the jail superintendent comes to know about it or starts suspecting that something is cooking. He can ask the prisoners separately and offer them a deal to reveal the plan. The offer is that if the prisoner volunteers to reveal about the escape plan, he will be rewarded with a shortened sentence.
Any Game Theory scenario must be understood in terms of ‘Payoffs’; gains(to be maximized) or costs/losses(to be minimized) for the players involved.
In case there is an investigation of the Prisoners here is how the scenarios look.
Case 1 – If only one prisoner reveals the truth to the superintendent, his jail term is pardoned and now he has 0 years and other gets 20 years. In this case the prisoner who has revealed the plan to the superintendent has ‘defected’.
Case 2 – If both remain silent and don’t divulge the plan they both get 5 years with a chance to escape. In this case both the prisoners are ‘cooperating’ with each other.
Case 3 – If both divulge the plan, 10 Years sentence to both. In this case both prisoners have ‘defected’.

As you can see the Case – 1 looks the most beneficial to the prisoner BUT only as long as the other prisoner doesn’t defect. This is where lies the Prison’s Dilemma! Realize that in this scenario the jail superintendent is interrogating them separately, so they cannot discuss. Even if they could, there is always a temptation to defect and the associated dilemma. In fact, the dilemma is always there because one prisoner doesn’t know the choice made by the other.
The question is, what choice should the prisoner make? Each party will try to make a decision such that by they cannot be worse off by the decision taken by the other party.
Each party will think how to optimize their payoffs. Make a choice so that they can maximize their profit or at least minimize their loss. Each is aware that the payoff is dependent on what the other party does. Maximum payoff is if one defects (cheat on his fellow partner prisoner) and hopes that his partner would remain true to him. This we have already seen is untenable.
The only natural equilibrium is the case where both prisoners defect. Because in this case one is not going to be any better off by changing his position unilaterally.
This is called the Nash Equilibrium. Nash Equilibrium is a natural un-enforced scenario that all parties naturally settle for.
This scenario is played out in everyday business or international relations. The Cold war and nuclear disarmament remained stuck in Nash Equilibrium for decades.
This same applies to merchants in a market to offer or not offer discounts. They can cooperate by increasing the prices together. But sooner or later one merchant will defect and offer a discount and reap greater profit by way of increased sales.
But, there are about 20 million websites that already tell you that. This blog isn’t about Nash Equilibrium.
Let’s take it further, most interactions happen multiple times. If there is a single interaction, the parties would behave in a certain way. But if you have to deal with the same parties again and again, then the dynamics changes.
Take the example of a driving and traffic rules. Each driver has a choice to either break the rule or follow the rule. In a scenario where you are going from home to office, lets break the journey into 10 sections. Each section being a decision point.
But you are not the only one going to work. There are other drivers on the road too.
So here are the payoffs.

As you can see, the payoffs are not difficult to understand. If everyone follows the traffic rules it takes them certain average time per section. But if you break the rule, you can on an average gain on them. But when you are following the rule and some other driver breaks the rule, it might force you to stop and you will slow down and the other will gain at your expense. And then, there is a case when both you and the other driver break the rule…it could be a dead lock, a serious accident. One way or the other when both you and the other break the rule, the average time for each such interaction increases.
So what should you do, break the rule or follow the rule? This is the Prisoner’s Dilemma playing out it daily life.
But these are multiple interactions, again and again and again. Each section of your journey is a decision point. And all 4 options are possible. And all will happen in various percentages totaling up to hundred.
So the question is how often should you or would you break the law? This blog is about finding that answer.
Simulation.
To find the answer, we will need to design a simulation.
Let’s say you have a certain driving style where you seem to break the traffic rule X% of the times. lAlso, Let’s say the other drives of your city break the traffic rule at an overall average of Y%.
Both X and Y can take continuous values between 0% and 100%. But for the sake of simplicity, lets work with fixed 11 values of 0%, 10%, 20%, 30%…..100%(represented as fraction 0, .1, .2,…..1). Now you have 11 X 11 = 121 combinations.
For a case where If you break the rule say .2 (20%) times and the city’s average is say .1(citizens of the city break the rule 10% of the time as a collective average), then
Both You and other Break the rule = .2 X .1 = .02 i.e. 2% of the times it takes you 10 min for that section
You break rule and other doesn’t = .2 X .9 = .18 i.e. 18% of the times it takes you 3 min
You follow the law but other breaks it = .8 X .1 = .08 i.e. 8% of the times it takes you 7 min
Both you and other follow the rule = .8 X .9 = .72 i.e. 72% of the times it takes you 5 min.
The weighted average of the above 4 would be = (.02 X 10) + (.18 X 3) + (.08 X 7) + (.72 X 5) = 4.9 minutes.
As you can see, in this one scenario (out of 121 discreet scenarios that we can create), if you break the traffic rule 20% of the time as compared to the city average of 10%, your average journey time per section of your trip will come down from 5 minutes to 4.9 minutes.
If you broke the rule 20% of the time and no one else broke the rule at all, your journey time will come down to 4.6 minutes.
Let’s take an example of a city where most drivers break the rule much often and the city average of breaking the traffic rule is say 60%.
If in that city you also broke the rule 60% of the times, your average would come to (.36 X 10) + (.24 X 3) + (.24 X 7) + (.16 X 5) = 6.8 minutes.
These are examples of simple deterministic weighted average of the 4 scenarios and its payoffs(or cost in terms of time in this case).
We can use a simulation to create multiple interactions and also instead of working with single deterministic average for each of the 4 interaction scenarios, we can use a range.
For Example:
When you and other both follow the rule: Average Time 5 minutes or a range between 3 to 7 minutes
When you break the rule and other follows the rule: Average Time 3 minutes or a range between 2 to 4 minutes
When you follow but other breaks the rule: Average Time 7 minutes or a range between 5 to 9 minutes
When you and other both break the rule: Average Time 10 minutes or a range between 7 to 13 minutes
The multiple interactions that a driver will have on the road can be modeled through a simple Monte Carlo Simulation in an XLS.
Monte Carlo Simulation
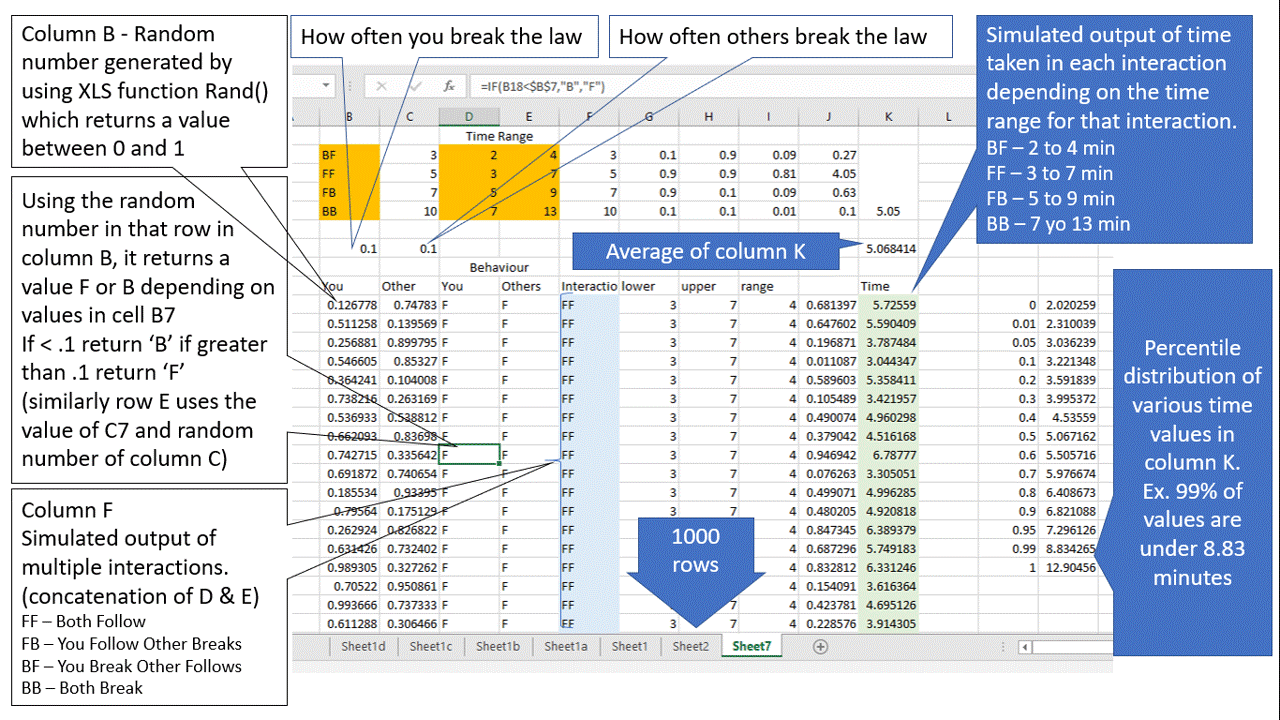
Monte Carlo simulation uses random numbers to simulate a large number of possible scenarios. In the above case column B has a random number generated between 0 and 1, as long as that number is less than .1 (or whatever I put in cell B7) if will return ‘B’ in column D for the corresponding row. This will create a column of ‘B’ and ‘F’ where .1 (10%) of the values will be ‘B’. Similarly for column E. Column F is a concatenated value of column D and E i.e a random ‘interaction’ outcome i.e. a combination of FF, BF, FB, BB with 10% B in the first and 10% in the second place(In the above example you only see FF in the first few rows because about 81% of the rows will be FF. Further down on the xls FB, BF and BB also appear). Using another random number in column J, I generated a time output column K, which is with in the corresponding time range for each interaction type(FF, FB, BF, BB).
As you can see the average time from the 1000 simulated rows is close to the weighted average but will never be exactly the same. This is understandable. Also, the simulation gives you a distribution range. if you only have a weighted average you do not know how often will an average go beyond say 7 minutes. With the simulation we can now that 93% of the times the average will be below 7 minutes and 99% of the times it will be below 8.83 minutes.
I will come back to a more interesting application of Monte Carlo simulation – How to predict user load for a website or a app – in a separate post.
For now I will continue with the Game Theory.
Using the weighted averages, for the 121 combinations, the following table gives the average time for each interaction a driver has on the road.
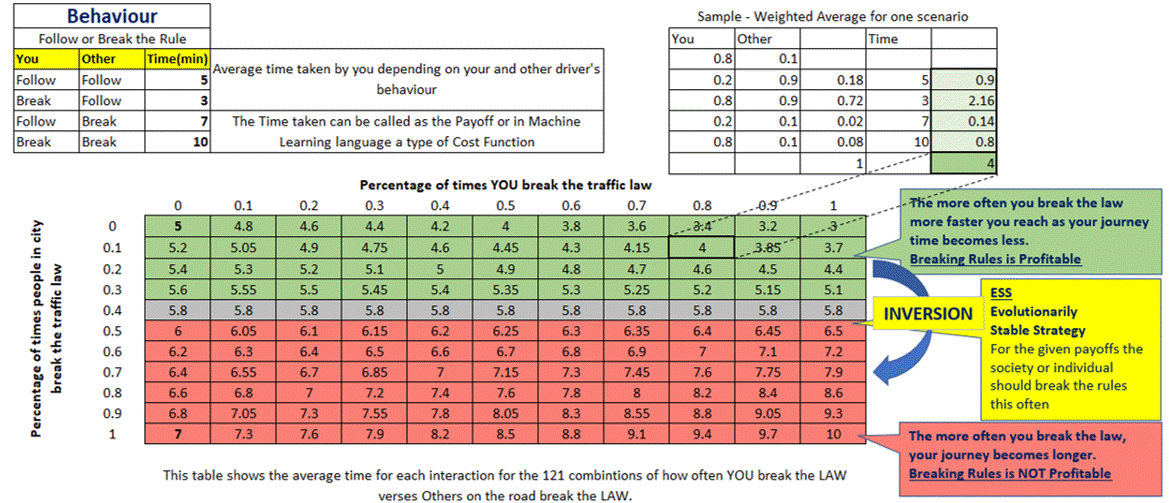
Since your average time is dependent on the behavior of others, there is an interesting pattern you will notice in the above table. As long as other people in the city are disciplined, it is advantageous for you to break the law. In the above table, the green rows show that the journey time reduces as you move from left to right in that row i.e. if the average probability of other drivers breaking the rule is say .2(20%), then the more often you break the rule the greater is the advantage to you. The red rows are the ones where the journey time starts increasing as you move from left to right in that table.
As more drivers in the population start breaking the rule, you will run into a lot of Break-Break scenarios and at a certain point it will not be profitable for you to break the rule anymore.
In the above example with the time (cost or payoffs) of 3, 5, 7, 10 minutes, you see that once drivers start breaking the rule more than 40% of the time, it becomes unprofitable to break the rule.
At a city average of 40% it will not matter how often you break the rule. Knowing that it doesn’t pay to break the rule, more citizens will follow the rule, as a consequence the city average will fall below 40%, at that point it will become profitable to break the rule again, so some more drivers will start breaking the rule and the average will climb back to 40%.
Opposite can also happen. More people may break the rule and the city average may become 50%. But then, immediately, it will become more profitable for any driver to follow the rule, so more people will stop breaking the rule and the average for the city will swing back to 40%.
If you have a city with 50% rate it will be pulled down to 40%, if you have a city average of 30% it will be pulled up to 40% again. This 40% is called the Evolutionarily Stable Strategy – ESS (Refer Richard Dawkins’ The Selfish Gene of how hawks and doves in a colony eventually reach an ESS)
Where the equilibrium value of the ESS will settle, depend on the payoffs.
Below are the results based on modified payoff values.
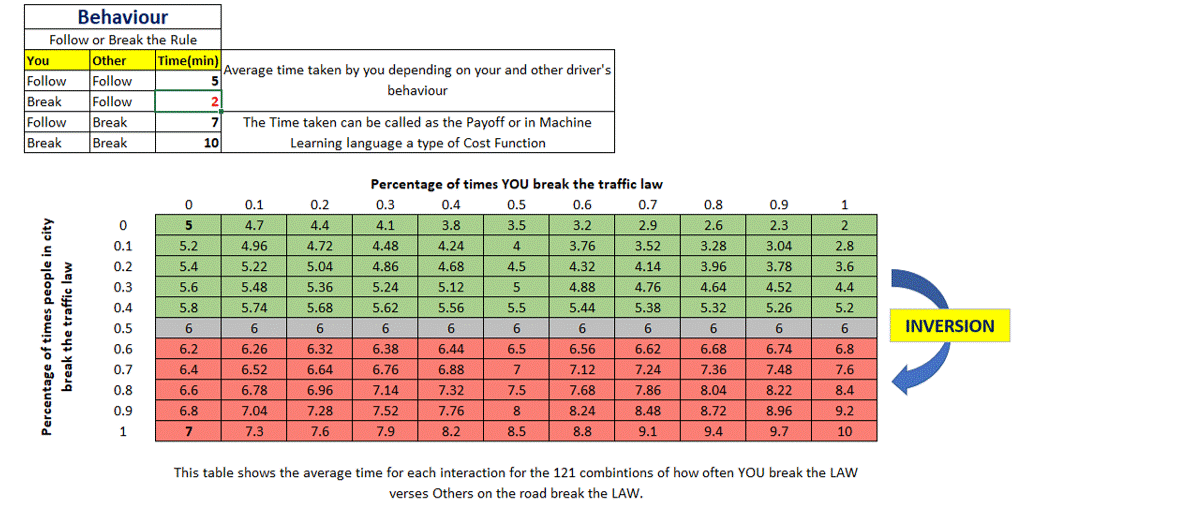
If for the BF(you break other follows the rule) scenario it reduces the journey from 3 minutes to 2 minutes, more drivers will start breaking the rule and the ESS will shift from 40% to 50%
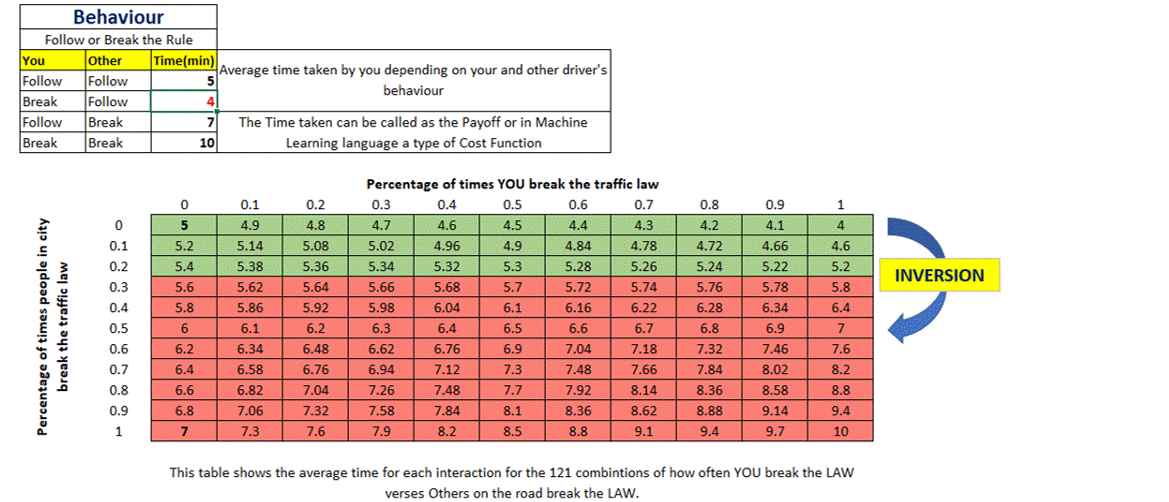
If for the BF scenario the journey time increases 3 minutes to 4 minutes, the ESS will shift from 40% to somewhere between 20-30%(it can be calculated, though not seen in the scenarios elaborated in this table)
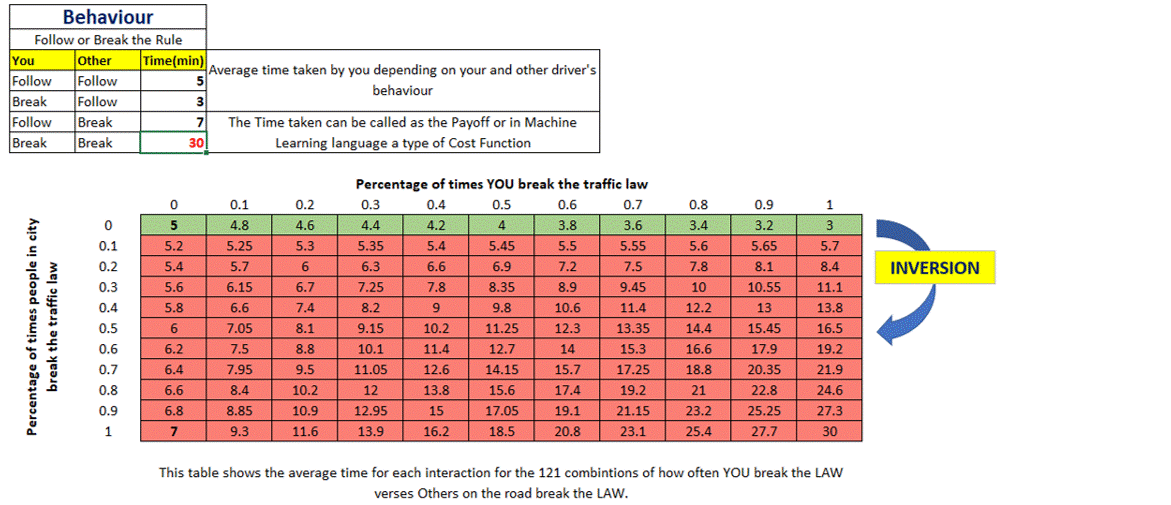
If the BB scenario becomes prohibitively expensive then also drivers will stop breaking the rule and the average will come down to somewhere between 0-10% for the BB journey time value of 30 minutes.
There are some additional terms like ‘Price of Anarchy‘ POA, When some elements within a system break the rule, it introduces a certain amount of anarchy in the system. The question is ‘Who pays the price of that anarchy’? Clearly in the top half of the table, in a city where the drivers generally follow the rule, it is the others who pay for your anarchy.
Conclusion
How do societies resolve it? Simple by imposing a sufficiently large penalty on those who break the rule, thereby reducing the payoff(or increasing the cost) and shifting the ESS equilibrium towards a lower percent of rule breaking.
The above example of Game Theory and Monte Carlo are based on an assumption of ‘perfect rational choices‘. Humans as we know, are ‘Irrational Beings‘ :). Pride, Honor, Sense of Fairness, Justice, Charity etc. are all irrational behavior. (Irrationality over here means, choices that you make that do not improve your payoffs). However, Monte Carlo simulation provides an excellent method of modelling both human and system behavior.


Leave a comment