The Estimate Magic Cube – EMC
During my workshop sessions, Estimation is frequently cited as one of the top 3 challenges faced by Project Managers.
There are multiple dimensions to this challenge. Firstly, the problem of defining what needs to be estimated and then the issue of applying the applicable productivity to arrive at the estimates.
Establishing a Process Capability Baseline(PCB) for productivity, remains a challenge for most organizations, but a major part of the problem lies at a much earlier stage, even before you can apply the productivity.
Issue No. 1 – Requirements Vs Scope or Product Scope Vs Project Scope
Most Project Managers are unable to distinguish the basic difference between ‘requirements’ and ‘scope’. The most common understanding is that ‘scope’ is the applicable sub-set of the ‘requirements’. So, if a product had a list of 20 features to build, your scope may be just to build 15 of them in this project and that is your scope. This is a fundamental mistake and this hinders the project manager’s ability to estimate.
Requirements or ‘Product Scope’ is the list of functional and Non-functional aspects of the product. The features that need to be built and the kind of performance expected from the product (non-functional requirements).
Project Scope is the list of all deliverables of the project. This includes not only the end product, design documents and manuals but also project management artefacts like project management plan etc.
Issue No 2 – Size Vs Estimates
Again, my observation is, project manager’s lack of distinction between these two concepts. If you have to estimate how much does it cost and how long does it take to travel between Pune and Mumbai, the problem has to be split into two parts i.e. sizing and then estimating.
The distance between Pune and Mumbai is not a matter of estimation, it is a matter of sizing(you can always argue that you can estimate the distance, but you don’t have to. You just have to measure the distance. The distance is already fixed whether you have the instruments and methods to measure it accurately or not).
Once the size of the distance to be traveled is measured, the time and money needed can be estimated (they cannot be measured, because they will happen in the future. They can only be estimated).
This is where you now need to apply the rate/productivity. The rate known from previous journeys. The productivity figures applicable to that domain. In software, how many function points of Java application can you build per person month of effort.
Issue No 3 – Relation between Scope and Productivity not clearly established.
Any productivity (or rate) figure that you use has to be for an associated ‘Scope’. You can only apply it if your scope of work matches the scope covered by the productivity figure you are using.
Let’s see this with an example;
If you are to calculate the average speed for your journey between Pune and Mumbai, you would want to know did that journey time include a rest stops. Say the 120km had a journey time of 3 hours, does the 3 hours include the 30 minutes of rest time or is it excluded and the 3 hours was the time vehicle was moving.
This simple point has implications in how you collect data, how you define your metrics, how the value of various rates like productivity (how many function points per person month of effort can your organization deliver) are calculated. Does your productivity include the effort towards project management or does project management effort need to be added over and above, after the engineering effort has been estimated?
Java Development Productivity -1
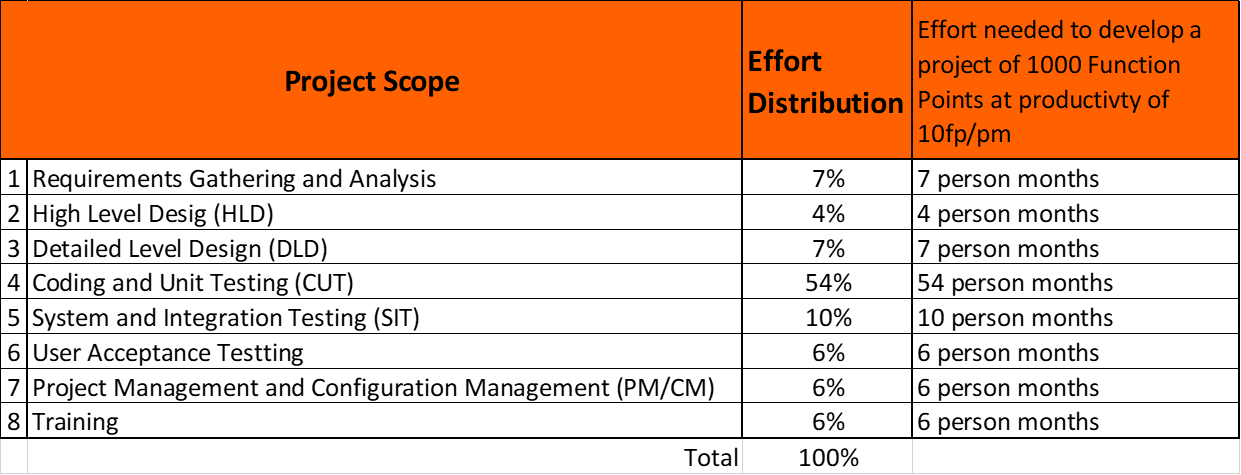
10 FP/Person-month (But what does this productivity include?) or 1/10 month per FP. This productivity associated with the following scope(scope is best represented as Work Breakdown Structure or WBS).
- Requirements Gather and Analysis
- High Level Design(HLD)
- Detail Design(DLD)
- Programming/ Coding and Unit Testing(CUT)
- System and Integration Testing(SIT)
- User Acceptance Testing Support(UAT)
- Project Management and Configuration Management(PM & CM)
- Training
Java Development Productivity – 2
13.2 FP/Person-Month or 1/13.2 Month per FP. This is associated with the following scope of work.
- High Level Design
- Detail Design
- Programming/ Coding and Unit Testing
- System and Integration Testing
Using Productivity – 1 you will get the complete effort for the project. This is like an average speed of a previous journey calculated using the journey time that includes the time spent on rest stops. So, when you next time take a similar journey you know that the 3 hour includes some time for a rest during the journey. How much time is available for rest is the next level of supporting detail that each productivity figure should publish.

Using Productivity – 2 will give you the engineering effort for the development project, assuming that the customer has already done the Requirements Gathering and Analysis and its output is already available. The HLD phase would have a portion of effort spent towards understating and reviewing the Requirements. This means that the HLD phase of Productivity-2 would most certainly need slightly higher effort than the one calculated in Productivity-1(where the HLD phase won’t need to review requirements as the same team would be doing the requirements). The project management effort will have to be calculated separately and then added to the estimated effort for the project.

Issue 4- Not mapping Requirements, Sizing, Scope with Productivity and Estimates
Whenever you are going to be estimating a Project, these 5 terms need to be seen together. Project Estimate will depend on both Requirements and Scope. Requirements need to be sized and productivity for the Scope needs to be established(What productivity will you use? Where will you get that data from?).

What we are estimating is the effort needed to produce the work(Scope/Deliverables) for the Requirements (Functional and Non-Functional features of the product). This is a 2 Dimensional ‘Area’ in the graph. If either the scope or requirements get added or reduced, the area will increase or decrease.
The Requirements need to be ‘Sized’. It could be in Function Points or Use-Case Points or Story Point. Then, for the Scope of the project the Productivity or Rate needs to be used has to be determined. This figure can meaningfully only come from past data or you will end up taking a guess. Even if you guess, that can at best be a starting point and ass you start delivering, the actual data should be available to you and that should form the basis for future productivity.
The area in graph needs to be determined. The estimated effort for the work can be arrived at by multiplying this area(formed by requirements on one axis and scope on the other) with Productivity.
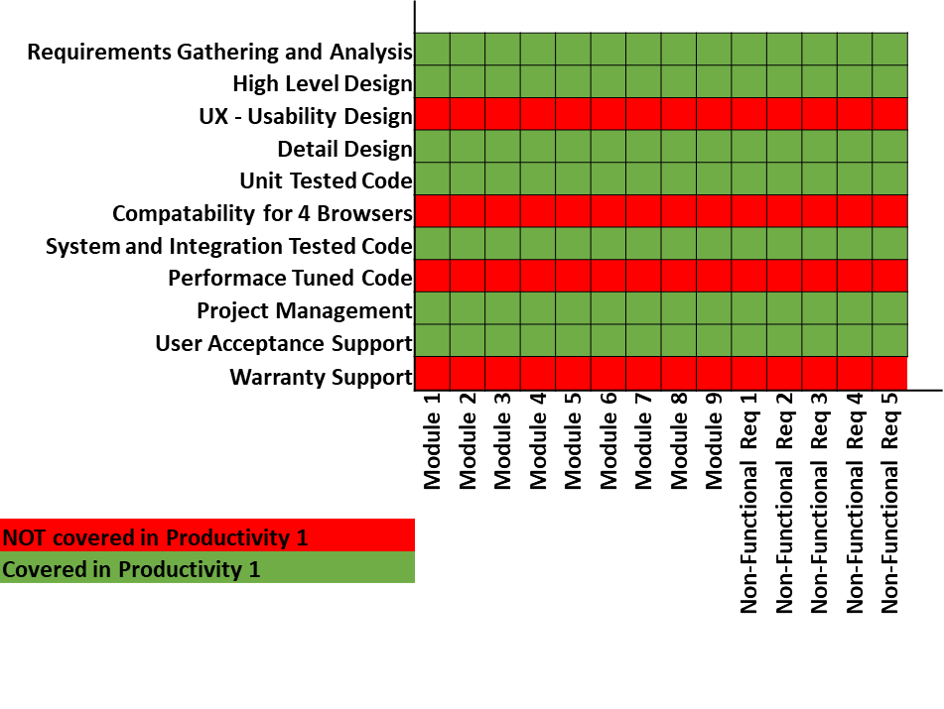
As you can see the Productivity-1 figures published above when applied to these requirements only cover certain area. The effort for the rest of the area is unaccounted for (reverse may also be true. If project management is not in your scope, that effort should be removed).
Whatever part of the scope is not covered by the productivity has to be estimated separately and added to the base estimate to be able to come up with the total project estimate.
The part of scope, like Usability Design, Multi-Browser Testing, Performance Engineering (Testing and Tuning) that are not part of the base productivity need to be estimated separately and added to the basic estimate.
Let’s say the Total Function Points for the features to be built in the product are 1400, then the effort estimates for the area covered in green would be 1400 * 1/10 = 140 Person Months.
The estimates for
- UX Design
- Multiple Browser Compatibility
- Performance Engineering
can be done in multiple ways.
- Add a percentage to the base value for each. Example – Performance Engineering effort as a percentage of Design effort. What percent of design effort is needed should be established after studying figures of similar projects where performance engineering had been done.
- Use parametric method with a per unit rate. For example, a per screen effort needs to be established and then that should be used to arrive at estimates for the additional browser testing. In all these cases referring to the data from past similar projects is imperative. Otherwise any effort calculation is just numbers pulled out of thin air.
Conclusion
Most project managers look at estimation as a single dimension list of tasks with which they can associate some rudimentary Simple/Medium/Complex kind of rate and add it up to some effort figure. This bottom up approach works in very limited scenarios of small and simple software projects. The project managers aren’t using a top-down approach, which can be very effectively used once the productivity for specific scope has been defined and figures for it have been published.
The Estimate Magic Cube – EMC
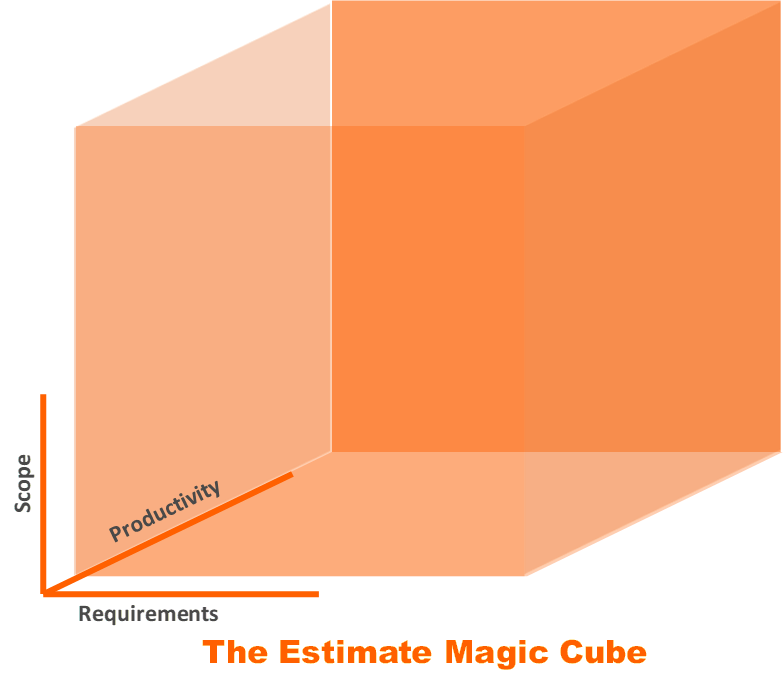
Estimate should be seen as a 3-Dimensional outcome rather than 1 or 2.

The total estimated effort for a project is an outcome of Requirements X Scope X Productivity.


Leave a comment